Back to Content
CopperCube Scripting overview
The simplest way to script CopperCube apps is to use the Execute JavaScript action, and write your JavaScript code directly in CopperCube. Take a look at the JavaScript scripting reference
for a list of all available functions. JavaScript code will run on all publishing targets, including Windows .exe, Mac OS X .app, WebGL apps and the Android target.
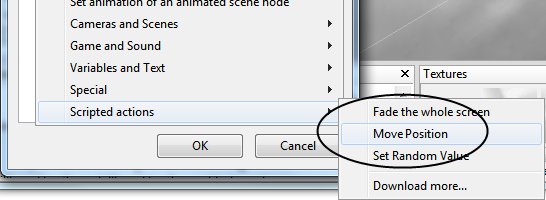
Additionally, you can create your own actions and behaviors with the same API, and share them with others, using the same javascript API, like the scripted actions shown below, which have been created in this way:
How the extension and scripting system works
For using/creating/downloading a new Action or Behavior, you only need one single file, which is a standard JavaScript text file. You only need to save it into the extension directory (Documents\CopperCube\extensions on Windows, ~/Documents/CopperCube/extensions on Mac OS X). You can edit and save the files there with your favourite text editor. CopperCube automatically re-reads these files when creating your app every time, so it is very easy to use and develop.
Creating your own extensions
Downloading extensions
If you don't want to learn programming, you can download an use extensions created by others. There are extensions available on the official website:
Quickly trying out scripting using the 'Execute JavaScript' action
Alternatively, you can also directly use the JavaScript API using the built-in Execute JavaScript action. No need to create an action or a behavior if you don't want. Just type the code right into the 'Code' section of that action.
See the JavaScript scripting reference for a list of available functions.
Programming and Debugging Tips
Here are some usful tips for programming and debugging with CopperCube:
- If you want to quickly verify the code you just changed when creating an action or behavior, in the Editor, use the command
"Edit -> Plugins -> Reload and Verify Extensions" to see if your action is valid, and if the JavaScript compiler accepts your code.JavaScript errors in your code will be printed then as well
- Error output for your code is different on all publishing targets. When running the generated Windows .exe or Mac OS X .app
target from CopperCube, a debugging window will be shown with all errors happening. This is probably the most useful way for debugging. You can use the function 'print()' in this target to print debugging messages into that console as well. If you are using
the WebGL target, error messages will be printed into the JavaScript console of your browser.